Showing posts with label analyses. Show all posts

Thursday, March 10, 2016

2015-2016 Boys team strength across WA clubs

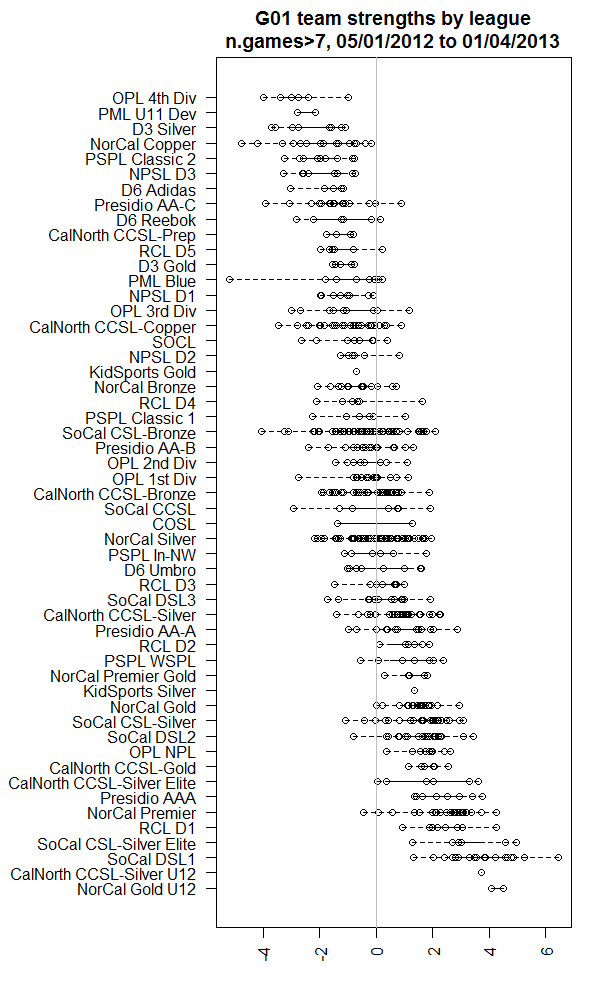
This is an update to two other posts I did on the strength of different club teams in WA and how team strength changes with age.  Read those for background on this post.
2012-2013 Analysis
2013-2014 Analysis

The plots break out the team strength (of the strongest team for each age from U12 to U18) by individual club.  This gives an overview of the types of teams different clubs produce, what strength their A teams tends to be at, and whether the club fields teams at every age.  The dashed black lines are the strengths of the B teams, so you can see which clubs have A and B teams.

The red line is the median strength of the top teams at age in Seattle United, Crossfire Premier, Washington Premier FC, and Eastside FC. The are the four largest and strongest clubs in Washington and consistently produce a top 4 team across most every age. The dotted-red line is a strength -2 below the top team (or -200 on new scaling). The predicted goal ratio in a match-up between a team on the red line and one on the dotted red line is 4, so 4-1 or 8-2. So the red line team is heavily expected to win, but it would not be a complete blow-out. The green line is the median across all the top teams from every select club in Washington, except those top 4.


B03 at far left, B97 at far right. 
1pt difference is about the length of this hyphen - on this graph. Yes, small. Being 1 full pt stronger = scoring 2x as rapidly so is a significant advantage. So being on the green line versus slightly above it indicates a big difference in strength. The red line teams score about 20-30x more rapidly than the green line teams.  This means that by the time the green line team scores once (on average), the red line team could have scored 20-30 times.
 
-------------------------------------------------------------------------------------------
 
The first plot shows 2013-2014 versus 2015-2016 for 16 clubs (all clubs shown in the next plots).  The 2013-2014 clubs were chosen because they have teams at each age U12-U18 and have B teams at most ages too.   The 2015-2016 clubs were chose to match those from 2013-2014.  The red line is the median strength of WPFC, EFC, xFire, and SU A teams.

Generally speaking the patterns have stayed similar.  SU's plots in particular look similar.  Crossfire has some interesting variation now between A and B teams with many B teams close to the A team strength.  That wasn't apparent 2 years ago.  Eastside's A teams seem to have gotten more consistent but their B teams have dropped down to the green line.  SSC Shadow A teams have become more consistent, i.e. no much weaker age groups.  The other smaller RCL clubs remained fairly similar: they still show variation in strength across ages and gaps in B team coverage.  There are 3 non-WYS clubs listed which field teams at all ages and B teams at many ages: ISC, ECFC, Pacific FC.  ISC has gone down in strength with its top teams no longer above the dashed red line, but it filled in gaps and has fairly consistent strength across ages.  ECFC also dropped in strength to the green line, but filled in age gaps and smoothed out variation among the ages.  Similarly Pacific FC filled in missing ages and increased the number of B teams.

2013-2014


2015-2016

 
-------------------------------------------------------------------------------------------
 
These are the plots for all clubs with a B03 or older team.


Sunday, May 25, 2014

High schools attended by players on the Crossfire and Sounders Academy U15/U16 teams 2010-2014

Crossfire Academy

Using the rosters on the http://ussda.demosphere.com pages for the Crossfire Academy U15/U16 teams for the last 4 years and recorded data on the high school listed for each player.  In most cases the HS was listed on the USSDA team page.  When it wasn't, I did a google search.  In many cases a google search would come up with a local article mentioning them in a HS game (soccer or other sport).  High schools were categorized as Eastside (Redmond, Bellevue, Issaquah, Mercer Island), Seattle/Shoreline, South SeaTac (Tacoma, Auburn, Kent, etc), Everett/Snohomish Area and Other.  Very few players were in Other. High Schools in each category are at the bottom.

The figure shows the fraction from a high school in each region for players listed on the roster of the Crossfire Academy U15/16 team (all players listed) from 2010-2011 to 2013-2014.  Overall the fraction of players from Seattle and South SeaTac high schools declined during the 4 seasons with sudden drop of players attending Seattle area high schools in the 2013-2014 season.


Interestingly the Seattle high schools for the players is overwhelmingly private.  Seattle private high school attendance is approximately 20%, while 70% of the academy players attended a private high school.  Sample size is small however (7 players with 2 public and 5 private).  The private/public split of the players attending eastside high schools matches the approximate private HS attendance on the eastsite (ca 10%).  12% of players going to an eastside HS attended a private school.  Sample size was 25 players (22 public and 3 private).


Sounders Academy

Same plot except that I wasn't able to get HS (not listed on the USSDA website) but the home town is listed.  So this shows home town.

Sounders and Crossfire U15/16 Academies together


Raw numbers
Note that roster # on the USSDA team page in 2011-2012 was unusually high.


U15/U16 2010-11 2011-12 2012-13 2013-14
Eastside 6 5 3 11
Seattle/Shoreline 5 5 2 0
Everett-Snohomish 4 4 2 2
South SeaTac 7 8 3 3
Other 1 5 4 1
EWA 1 3 1 0
Alaska 0 0 0 1
Unknown 3 2 4 4
Total known 24 30 15 18
Total 27 32 19 22


Categorization of HSs

Eastside (private are *)
Redmond, Mercer Island, Issaquah, Sammamish, Eastlake, Bellevue, Skyline, International Community School, Eastside Catholic*, Bellevue Christian*

Seattle/Shoreline is HSs in the SYSA boundaries.
 Seattle (private are *)
HS: Nathan Hale, Ballard, Lakeside*, Seattle Prep*, Seattle Christian*
Shoreline
HS: Shorecrest

South SeaTac
HS: Todd Beamer, Auburn Riverside, Puyallup, Mount Rainier, Stadium, Decatur, Highline, Thomas Jefferson, Woodrow Wilson, Kentridge, Rodgers, Emerald Ridge, Tacoma Baptist*

Everett/Snohomish/North SeaTac
Inglemoor, Glacier Peak, Snohomish, Everett, Meadowdale, Woodinville, Monroe, Henry M. Jackson


Friday, April 18, 2014

2013-2014 Club strength across A, B and C teams (boys)

Same as previous analysis for team strength across ages across clubs but now showing the A, B, and C teams in a club.  Only 16 clubs that had enough B teams across multiple ages to have an interesting plot.  B team also needed to be strong enough to appear on my plot (not fall off the bottom of the y-axis).

8 data points.  B02 (U11) on the far left and B95 (U18) on the far right.   Red line is the median of the A teams from WPFC, Crossfire, Seattle United and Eastside.  Green line is the median across all select teams (not clubs) in WA.

Thursday, April 17, 2014

2013-2014 Girls team strength across WA Clubs

This is the same analysis as for boys but for girls U11-U14.

Overall:

Compared to the boys, the top clubs have a lot more competition at U11-U14.  The red lines have a lot more black lines near them.

By club.  G02 on the far left.  G99 on the far right.  4 ages.  4 points.


2013-2014 Boys team strength across WA clubs

Following up on last years longer analysis of the strength of Washington clubs for boys,
here is an analysis of the strength of every select club's top boys team at U11-U18 in Washington.

Plot 1 shows and overview with Seattle United, Crossfire Premier, Washington Premier FC, and Eastside FC in red and every other club in black.  The green line is the median of all the black lines.


Plot 2 breaks this out by individual club.  This gives an overview of the types of teams difference clubs produce, what strength their A teams tends to be at, and whether the club fields teams at every age.

The red line is the median strength of the top teams at age in Seattle United, Crossfire Premier, Washington Premier FC, and Eastside FC. The are the four largest and strongest clubs in Washington and consistently produce a top 4 team across most every age. The dotted-red line is a strength -2 below the top team (or -200 on new scaling). The predicted goal ratio in a match-up between a team on the red line and one on the dotted red line is 4, so 4-1 or 8-2. So the red line team is heavily expected to win, but it would still be a somewhat competitive game. The green line is the median across all the top teams from every select club in Washington, except those top 4.

B02 at far left, B95 at far right. 
1pt difference is about the length of this hyphen - on this graph. Yes, small. Being 1 full pt stronger = scoring 2x as rapidly so is a significant advantage. So being on the green line versus slightly above it indicates a big difference in strength. The red line teams score about 80-100x more rapidly than the green line teams...


Wednesday, March 12, 2014

RCL D1 regional distribution

Here I look at the regional distribution of boys teams in the RCL D1 for fall 2013.  The RCL D1 is the strongest level of play in WA for all age groups except B97.  RCL is a closed league (closed to the clubs shown in the graphs).  However, except for B97, most WA teams at this level are playing in this league (the largest soccer clubs in WA are in the RCL so this is not surprising).

BU11-14
RCL is a state-wide league, but the top division in BU11-14 (32 teams) has about the lowest travel of any league/division.  Almost all teams (29 of 32) come from the SE Seattle-Tacoma-Bellevue Metro area: Redmond, Seattle, Preston, Woodinville, Tukwila, and Tacoma.  The longest distance, Woodinville-Tacoma is 50miles (ca 1 hr) and most games would involve under 30min of travel.  In the fall 2013 season, there were no teams from E WA, W side of Puget Sound or the Portland Metro area in RCL D1.  There was 1 team from N WA (Bellingham) and 2 from the N Seattle-Tacoma-Bellevue Metro area (Everett area).

BU15-18
At the HS age, BU15-18 (again 32 teams) the regional distribution of teams is more diverse and more "state-wide".  In fall 2013, most teams (21 of 32) still came from the SE Seattle-Tacoma-Bellevue Metro area. But N WA (Bellingham) had a team at 3 of the 4 age groups, and N Seattle Metro area (Everett) at least 1 team at each age group although these teams were not in the same club. There are 3 N Seattle Metro area RCL clubs: NWN, Rush and Snohomish. At U15, Rush had a team in D1, at U16 Snohomish, at U17 both Snohomish and Rush, and at U18 NWN.  This suggests that the N Seattle Metro area only has sufficient players to support 1 D1 team at the HS age.  This might explain why there are no D1 N Seattle Metro teams at BU11-14 as significant cross-club player-migration is needed to form a D1 team and this doesn't happen until HS age.

The Bellingham Metro area, despite being only the 5th largest metro area in the state, is well-represented in the HS RCL D1 with teams at 3 of the 4 ages.  The 4th largest metro area in WA is the Tri-Cities and is again is about 2x the size of the Bellingham metro area, but had only 2 teams in D1.  The N Portland Metro area (WA side) is the 3rd largest metro area and also about 2x as big as Bellingham, but is even less represented in RCL D1 at the HS age (1 team).  The second largest metro area in WA, the Spokane metro area, has no teams in the RCL D1.


What is driving these patterns?  The most obvious is population size.  If we look at county size versus # of HS boys teams in the RCL D1, we see see a strong relationship. 
  • King Co: Crossfire, SU, Eastside, PacNW, FCA
  • Snohomish: Snohomish United, NWN, WA Rush
  • Pierce: WPFC, FWFC, Harbor, Slammers
  • Spokane: SSC
  • Clark+Skamania: WA Timbers
  • Tri-Cities (Benton+Franklin)+Yakima: Three Rivers and Three Rivers Yakima
  • Whatcom+Skagit: Whatcom Rangers
  • Kitsap+Mason: Westound
  • #s from here http://en.wikipedia.org/wiki/Washington_statistical_areas


A couple things jump out:
  • Whatcom Rangers appears to over-produce RCL D1 teams relative to what you would expect given the population size of Whatcom+Skagit counties.  Both the Whatcom region has PSPL "competitors" but not at the RCL D1 level.
  • Spokane metro area has 2-3 fewer RCL D1 teams than expected.  However Spokane does have 3 HS teams at RCL D1 strengths, but they do not play in the RCL D1 (2 in PSPL D1 and 1 in RCL D2).
When we plot the same relationship for the younger ages U11-14 (red line and dots), there seems a very different pattern:
 First, it looks like the size of the player pool has a much bigger effect at the younger ages.  There seems to be a minimum population size of about 500,000 before a region is able to produce a team strong enough to compete in the RCL D1.

HOWEVER, there RCL is promotion-relegation and it may be that there is a initial selection bias at U11 towards the King County clubs and that this takes a few seasons to work its way out.  Next up, I want to repeat this but with my team strength estimates which won't have this initial selection bias.


Tuesday, March 11, 2014

Where WA boys U11-14 play select soccer

I took all the teams BU11-14 and divided them into E WA vs W WA.  There are 546 boys teams in the WA select soccer leagues.


Where W WA plays
65% of W WA boys U11-14 teams play in the USYS leagues: PML, DIII, NPSL, and RCL. The main leagues are the NPSL and RCL.  The former is open to all USYS leagues while the latter is a closed league with only some USYS clubs sanctioned as "RCL" clubs.  The strongest teams in the state play in RCL division 1 (15 out of 16) and come from almost exclusively four western WA clubs: Seattle United, Eastside, WPFC, and Crossfire Premier (15 out of 16 with the 16th being another W WA club).  PML, DIII, and NPSL are regional leagues serving respectively Vancouver/Portland region, south Puget Sound, and north Puget Sound.  Outside of RCL division 1, the strength of competition in the leagues overlaps considerably.  35% of W WA boys U11-14 teams play in the USCS leagues: PSPL and OPL.  OPL serves the Vancouver area WA teams (and Oregon) and PSPL is a state-wide league.  However, approx 20% of W WA teams in the PSPL are in the Copa division which is restricted to western WA.


Where E WA plays
In contrast to W WA, only 30% of boys U11-14 teams play in the USYS leagues: DIV and RCL. 70% of E WA boys U11-14 teams play in the USCS leagues: PSPL and PSPL-inland.  PSPL is the state-wide league and PSPL-inland is restricted to eastern WA teams.  The strongest eastern WA teams generally (9 out of the top 16) play in the PSPL league, with the older ages more often in the WSPL (state-wide) and younger strong teams often found in the PSPL-inland league.  5 out of the top 16 eastern WA teams play in the RCL and 2 in the DIV league.


Monday, April 1, 2013

Team strength by age and club in WA

4-4-2013.  Updated to include B96 (U16)
This post is for 2012-2013. Click here to see the 2013-2014 Boys analysis and here to see the 2013-2014 Girls analysis

I was interested in the pattern of team strength across BU12 to BU16 across all clubs in Washington.  Which clubs are able to consistently field the strongest teams across multiple ages?  Are some clubs able to do this consistently across ages or did most clubs have stronger and weaker age groups?  Are RCL clubs able to field stronger A teams on average?

To look at these questions, I took all the WA clubs that have a team at least 4 ages from BU12 to BU16 and computed the maximum "B00 strength" at that age for the club.  "B00 strength" means that each age was scaled to the median strength of WA-OR B00 teams.  That put all ages on the same scale.  "maximum strength at that age for club" means that I took the maximum strength of all teams a club had at a particular age.  For example Crossfire Premier has 4 B00 teams, and I took the maximum of those teams' strengths.  For Crossfire Premier, this is simply the A team strength, but other clubs do not name their A, B, C teams consistently so I just took the maximum the teams a club has at a particular age.

There are 37 clubs in WA that have a select team at each age BU12 to BU16.  This is out of 109 WA clubs in my database. This plot shows all the B00 strengths for these 37 clubs.  Each line is a different club.  There are three clubs that stand out in being able to field an exceptionally strong team at each age BU12 to BU15 and form the outer edge of the strength by age plot: Crossfire Premier, Washington Premier FC, and Seattle United.  Eastside FC is a close 4th, with a couple slightly weaker age years (U13 and U14).  At U16, Crossfire, WPFC and Eastside form the outer edge of the plot, but SU has an unusually weak A team.  No other clubs had more than two teams between BU12-15 that were within 2 points of the red top lines below.  The green line in the graph is the median strength at age across all clubs.

Comment #1: I would assume this result is driven by the size of the player pool.  Crossfire Premier fields 4-5 teams at each age.  Seattle United has 2-3 full-year teams and 6-8 part-year (aka select) teams at each age.  WPFC fields 2 full-year teams and is associated with a very strong part-year (aka select) club, WPFC Fury.  However I'm not sure how seamless the player movement is between WPFC and WPFC Fury.  Clearly though, WPFC is not hindered by a limited player pool.  Eastside FC fields fewer teams at each age (generally 1-2 less than Crossfire) and is not integrated with a select club.  This slightly smaller player pool may account for the greater fluctuation in strength across ages for Eastside FC.

Comment  #2: I'm slowly collecting match data on the top west-coast teams in order to pencil in where the top of this curve is for the west-coast boys.  My sense right now is that the top CA teams are 2 strength points above the top WA teams.  Maybe 1.5 but data points to a higher difference.

Next I looked at each club individually to see if there were any patterns between, say, RCL and non-RCL teams in terms of strength of teams across ages.  For this I looked at the strength of the top team in RCL versus non-RCL clubs.  I plotted Crossfire Premier, WPFC, Seattle United and Eastside FC separately since they were outliers even among the RCL clubs.  The boxplot below shows the results with the box enclosing the middle 50% of clubs at each age and the whiskers showing the full range of strengths.  I also added the strengths of the best teams from smaller clubs that do not have a team at each age.  What we see is that the best RCL teams are usually better than the best non-RCL teams, but that there is quite a lot of overlap---the whiskers on the boxplots of the non-RCL clubs overlap the boxes for the RCL clubs.  The green line is the median across all clubs (none excluded so same green line as in plot above).

Which clubs have a top team with a strength above the median "best-team" line (green line) at each age BU12 to BU15?
[1] "3 Rivers SC"           "Crossfire Premier SC"  "Eastside FC"          
[4] "NW Nationals"          "Pacific Northwest SC"  "Seattle United"       
[7] "Snohomish United SC"    "Spokane SC Shadow"     "Washington Premier FC"

Ah, those are all big clubs. Ok, let's set the bar a bit lower. Which clubs field a team with a strength above -1 plus the median "best-team" line (green line) at each age? So their strongest team has to be no more that 1 point below the median "best-team" so could have a competitive game with that median team. I'll divide this into RCL and non-RCL. I define "RCL" as having a team that plays in the spring RCL, so clubs that played in the fall RCL via the Open Cup are non-RCL in my grouping.

RCL (13 out of 21 RCL clubs do)
[1] "3 Rivers SC"           "Crossfire Premier SC"  "Eastside FC"          
 [4] "Federal Way FC"        "Highline Premier FC"   "NW Nationals"         
 [7] "Pacific Northwest SC"  "Seattle United"        "Snohomish United"   
[10] "Spokane SC Shadow"     "Washington Rush SC"    "Whatcom FC Rangers"   
[13] "Washington Premier FC"

Non-RCL (5 out of 27 non-RCL bigger clubs do)
[1] "Cobra Premier Soccer" "FC Spokane"  "Franklin Pierce SC (WPFC Fury)"  
[4] "Issaquah SC"          "Kent United"

Next question was what clubs can field teams that can compete with the top RCL teams?  Here "compete with" was defined as "having a strength within 2 points of the median of the 4 top clubs".  The 4 top clubs are Crossfire Premier, Eastside FC, Seattle United, and WPFC.  Although Eastside FC has some "weaker" ages, those "weaker" ages are still within 2 points of the other top clubs.  In the boxplot above, this median "exceptionally strong" team was the median of the red boxes.

Which clubs can field two teams within 2 points of the "exceptionally strong" teams? Three clubs other than the top 4 can field two teams within 2 strength points of the top:  "Issaquah SC", "FC Alliance" and "PacNW".  No clubs except the top 4 clubs can field 3 teams within 2 strength points of the top. 

Which clubs can field at least ONE team within 2 strength points of the top? For this I included the smaller non-RCL clubs.

Non-RCL clubs with team within 2 strength points of the top.  Number of ages fielded noted.
"Central WA Soccer Academy (1 age)" "Cobra Premier Soccer (4 ages)" "Emerald City FC (3 ages)" "FC Spokane (4 ages)"  "Franklin Pierce SC (WPFC Fury) (4 ages)" "Issaquah SC (4 ages)" "Pacific FC (4 ages)"

RCL clubs with team within 2 strength points of the top
"3 Rivers SC" "FC Alliance"  "Highline Premier FC" "NW Nationals"          "PacNW" "Snohomish United"  "WA Rush SC"  "Whatcom FC Rangers" 

This result is especially interesting to me. 15 clubs (besides the top 4) can field 1-2 teams within 2 strengths points of the top. 8 are RCL and 7 are non-RCL, and of those 7 non-RCL clubs, 2 are small clubs that do not field a team at each age.

Finally, here are all the individual plots for clubs with a team at least 4 age between BU12-16.  The black line is the max strength of the club's teams at a particular age.  The red line is the median strength for Crossfire Premier, WPFC and Seattle United.  The dotted red line is -2 below that, so a team above that dotted red line could play a game with the red line and not be totally gutted by more than a GD of 4.  Franklin Pierce SC = WPFC Fury.

B00 at far left, B96 at far right.
1pt difference is about the length of this hyphen - on this graph. Yes, small.
Being 1 full pt stronger = scoring 2x as rapidly so is a significant advantage.  So being on the green line versus slightly above it indicates a big difference in strength.  The red line teams score about 80-100x more rapidly than the green line teams....


Finally here is a table with B00 team strengths.  The median strong 4 clubs is for reference:
med.strong
   B00    B99    B98    B97 
 6.155  8.410 11.290 12.545
 
 
                                                       club   B00   B99   B98   B97
1                                               3 Rivers SC  2.10  5.33  7.02 10.83
2                              Academy of Soccer Excellence -2.27  5.58    NA    NA
3                                          Avanti United FC -2.52    NA    NA  0.52
4                                      Bainbridge Island FC  2.36  3.51  5.38  8.02
5                                             Blackhills FC -0.37  4.82  9.01 10.27
7                                               Breakers SC  0.08  4.35  6.09  8.16
8                                                Cascade FC  2.95  0.73  4.80  8.20
9                                  Columbia Basin United FC -0.47  5.44    NA  4.99
10                                  Columbia Basin Youth SA -3.73  2.11    NA    NA
11                                Central WA Soccer Academy  4.57    NA    NA    NA
12                                          Cheney Storm FC -1.10  0.27  4.96    NA
13                                        Chehalis Youth SC    NA    NA    NA  5.54
14                                        Central Kitsap SC    NA  1.02    NA  4.10
15                                     Cobra Premier Soccer  3.26  7.54  6.00  9.98
16                                     Crossfire Premier SC  6.67  8.73 10.65 12.44
17                                      Crossfire Select SC  1.92  3.87  7.31  7.59
18                                         Cowlitz Youth SA    NA    NA    NA  5.83
19                                                 Desna SC -0.73    NA    NA  3.58
20                            Des Moines Midway Soccer Club    NA -1.99    NA    NA
21                                              Eastside FC  5.84  7.14 11.39 11.31
22                                          Emerald City FC    NA  4.53  6.51 11.29
24                                              FC Alliance  5.93  6.59  7.16  6.24
25                                                 FC Crush    NA  0.08    NA    NA
26                                               FC Edmonds  1.40  5.76  5.54  9.23
27                                                  FC Kent -4.80    NA    NA    NA
28                                 Futbol Club Salmon Creek -0.85  3.58    NA  7.45
29                                               FC Spokane  0.68  5.04  6.77 10.62
30                                  Fife Milton Edgewood SC  0.43  4.20  3.80  4.33
31                                       Franklin Pierce SC  2.09  4.22  6.90 10.81
32                                              Fircrest SC    NA    NA    NA  3.08
33                                           Federal Way FC  0.82  5.13  7.14  8.61
34                                                Harbor FC -0.36  3.98  7.09  9.09
35                                             Highlands SC    NA    NA  4.07    NA
36                                      Highline Premier FC  3.25  6.48  6.76  9.27
37                                               Cascade SC -0.64  5.74  6.20  6.61
38                                              Issaquah SC  5.35  6.85  6.53  9.21
39                                              Islander FC -1.86 -1.06    NA    NA
40                                              Kajumulo FC    NA    NA  4.70  8.03
41                                              Kent United  2.22  5.22  8.72  8.20
42                                                Kitsap SC    NA  5.75    NA 10.47
43                                Kittitas Valley Junior SA  0.29  1.94  3.69    NA
44                                            Lake Hills SC -0.90  5.33  3.97  8.68
45                                                Legacy FC    NA  3.97    NA  7.63
46                                  Lewis County Volcano SC    NA    NA  1.35    NA
48                   Lower Yakima Valley Soccer Association    NA  5.45    NA  9.21
49                                         Mercer Island FC -0.45  3.12  4.81  8.30
50                                                Monroe FC    NA  4.25  4.86    NA
51                                         Mount Rainier FC  0.32  3.65  7.16    NA
52                                          Maple Valley SA -0.31  3.57  5.16  7.52
53                          North County Youth Soccer Assoc    NA    NA  6.44    NA
54                                         Newport Youth SC -0.93  2.46  3.72  6.35
55                                          North Kitsap SC  0.06  2.59  4.74    NA
56                                         Normandy Park FC  3.41    NA    NA    NA
57                                              Norpoint SC    NA    NA    NA  4.64
58                                          North Tacoma SC  2.80  1.15  3.58  9.45
59                                            Northshore SC  0.04  3.87  4.93  7.60
60                                             NW United FC  0.58  5.87  6.94  7.38
61                                             NW Nationals  1.81  6.49  7.51  9.12
62                                         North Whidbey SC    NA    NA  5.05    NA
63                         Vancouver United Soccer Alliance  3.53  4.27  8.11  7.83
64                                                Orting FC    NA -0.50    NA  4.58
65                                               Pacific FC  0.56  6.71  5.94  9.24
66                                     Pacific Northwest SC  3.03  7.50 10.89  9.64
67                                              Puyallup SC -1.19    NA  3.26  5.67
68                                               Pullman SC -0.47  2.85  5.47    NA
69                                            South Hill SC  1.70  4.72  3.42  7.19
70                                        Spokane Sabers FC -0.52 -0.14  4.88  6.37
71                               Soccer Club of Renton East -0.30    NA    NA    NA
72                                           Seattle Celtic  0.57  0.69  4.74    NA
73                                           Seattle United  5.95  8.09 11.19 12.65
74                            Spanaway Graham Eatonville SC -2.68  2.14    NA    NA
75                                                Silver FC -5.26    NA    NA    NA
76                                           Silver Lake SC    NA  2.03    NA  5.10
77                                          South Kitsap SC -0.84    NA    NA    NA
78                                  Rainier Valley Slammers -0.39  3.77    NA  5.97
79                                       Snohomish Youth SC  3.15  5.76  7.13 11.75
80                                     Sparta NorTac Select -1.52  3.12  5.21  6.70
81                                         Spokane Pumas FC -3.09  1.56    NA    NA
82                                         Spokane Scotties -1.52    NA  3.90    NA
83                                        Spokane SC Shadow  3.87  5.40  6.86 10.00
84                                        Spokane Shadow SC -6.43    NA    NA    NA
85                                            Storm King SC -0.69  3.54    NA  7.85
86                                                Sumner SC    NA -0.61    NA    NA
87                                        Sun City Strikers -1.10  5.99    NA  5.71
88                                 Spokane Valley United SC -2.02    NA  2.03    NA
89                                         Tacoma United FC -1.12  5.21  9.24  8.36
90                                        Terrance Brier SC    NA    NA  7.25    NA
91                                   Thurston County United -3.16    NA  3.78  5.26
92           Cowlitz Youth Soccer Association Timber Barons -1.52  3.70  3.63  9.97
93                                              Tracyton SC    NA  3.43  0.58    NA
94                               Tukwila Skyway Soccer Club    NA    NA  7.18    NA
95                                        Tukwila Skyway SC -0.27    NA    NA    NA
96                                            Tynecastle FC  4.14  4.32  4.97  8.86
97                             University Place Soccer Club -0.98  2.55  5.93    NA
98                                         Vashon Island SC    NA -0.30    NA  5.15
99                                       Washington Rush SC  3.70  4.01 11.31  9.54
100                                      Washington East SC    NA  4.17  8.19  9.87
101                                       Wenatchee Fire FC  0.04  6.41  6.76    NA
103                                            Westsound FC  0.79  3.92  8.04    NA
104                                        West Highline SC -2.07    NA  0.99  4.50
105                                      Whatcom FC Rangers  1.55  5.70  7.20 10.94
106                                   Washington Premier FC  6.36  9.10 11.43 12.89
107                                         West Seattle SC -0.37  3.34  4.51  9.04
108 Camas Washougal Soccer Club (Washington Soccer Academy)  0.60  0.65  8.71  8.89
109                                            XiFA Academy -0.19  3.92  7.38 10.45


Saturday, March 23, 2013

Fall league comparison B99

Scaled so that 0 is the median strength of the B99 teams. This uses my old scaling but shows the relative strengths of the WA, OR and BC B99 leagues.

Fall league comparisons B00

Scaled so that 0 is the median strength of the B00 teams. Note this is uses the old scaling of teams, but shows how the WA, OR and BC fall leagues compare.

Monday, March 4, 2013

Relationship between team age and team strength

I originally thought that I would need individual team age data to get at the question of 'how much strength is a year' equal to.  However a fellow statistician suggested that this could be estimated by looking at how well teams did playing at age versus playing up a year.  Computing the age-effect this would require however cross-age match data and multiple ages.  With help from a fellow poster on washingtonpremiersoccer.com, I compiled match data for the U12, U13, U14 and U15 boys teams in WA and OR.  This analysis required that I had almost all select teams at each age group so that I could assume that 'median' team meant the same thing in each age group (i.e. that I wasn't biasing my samples up or down in any age group).

This new database allowed a joint analysis of team strength using all U12-U16 select soccer team matches in WA and OR for the 2012-2013 season (up to March 3rd, 2013).  Cross-play between age groups in tournaments and leagues (when teams play up) allowed all age groups to be analyzed together.  The following graph shows a boxplot of team strength against age.  The y-axis has been scaled to the median team in this analysis, but the meaning of relative differences remains the same as in my region-specific strength ratings:

0.0 0.5 1.0 1.5 2.0 2.5 3.0 3.5 4.0
win 34 49 63 76 86 94 98 99 100
tie 31 29 24 17 11 5 2 1 0
lose 35 22 13 7 3 1 0 0 0

A difference of 2 in strength is quite large and the weaker team would rarely win.  A difference of 1 still means a substantial advantage for the stronger team.  The x-axis in the graph is the date of the first age in the age group.  These are US teams and the age brackets start on August 1st.


The graph indicates a striking consistency in the impact of age on team strength.  From age U12 to U16, each year adds 2 strength points to the median team strength.   Thus teams are unable to beat themselves a year later and unlikely to beat themselves 6 months later (if they could enter a time machine and play themselves at an older age).

This suggests that the capacity to increase team strength by selecting older players is substantial, however the spread of team strengths within age is ca 10 (highest team minus lowest team).  Thus age bias on teams is (obviously!) not the only factor affecting team strength.  This also suggests that computing a "age-correction factor" for team strength should be simple.

age adjusted team strength = 
    unadj. team strength - (6.5-mean(birth months of players))/6

where birth month is coded as Aug=1, Sep=2, Oct=3, etc.  6.5 is the mean birth month so this scales the team to "expected strength if team were median age".

Why is an age-correction factor important?  Well if you are trying to understand the strength of a team and how factors other than age affect team strength, then you need to adjust for the team age.  If you want your team to play up in a tournament, then you need an idea of what its strength will be at the higher age so you can choose an appropriate level.  Also if a coach/club happens to have a team made up of summer boys, they might well want to have a sense of the "adjusted" strength of the team if the team were not essentially "playing up".  Or a club might want to compare the strengths of their A and B teams, but for a fair comparison you need to adjust for the age difference between the teams.

What is driving this relationship?  Presumably it is the pattern of physical growth in boys.   The growth curve is pretty linear from U12 (age 10-11) to U16 (age 14-15).  I'll be able to get a better sense of this relationship once I get more U17 and U18 teams and see how the strength levels off.

What next?  An interesting aspect of the age-skew, is that on an age-skewed team, the innate talent is not at its maximum because less talented older players would be chosen over more innately talented, but smaller, young players.  Nonetheless, the strength of the team is higher with the age-skew because age adds greatly to team strength.  As the team ages (U17 and up), one would expect that the age-skew would be reduced as 12-months doesn't confer quite as much advantage.   A question that interests me is how much this age-skew persists in U20+ teams and whether there are other effects of the age-bias, such as positional bias.   The only July boys on an elite (non-academy) team or Dec boys on an academy team would have to be unusually talented (on average).  Are those talents directed to particular positions?  Presumably July (or Dec) goalkeepers would be rare for example.  Another question that interests me is whether Dec professional soccer players have higher valuations than Jan professional players.  Why would that be the case?  In a system with a January cut-off, more Jan born players of lesser innate talent are developed.  The only Dec born players that make it through the system would have to have (on average) higher innate talent.  If innate talent is correlated with valuation, one would expect Dec players to have higher valuations (on average).

Monday, January 21, 2013

Comparison of the B00 RCL D1/2 Fall standing using only summer data

One of the things I want to explore is whether summer data is a good predictor of Fall league performance.  If so, it suggests that normal summer tournament data, without resorting to special ranking tournaments, can be used to help set Fall league composition.

Here's the first analysis.  I compared simulated the B00 RCL D1 Fall league using only the summer data for B00's.  Here's the results with the actual standings on the right.  The summer results picked out the top 3 pretty well.

                        1st 2nd 3rd 4th 5th 6th 7th 8th
FC Alliance A B00         0   0   0   4  21  30  28  18  4th w 21 pts, GD 7
Crossfire Premier B B00   1   4  16  61  14   3   1   0  5th w 16 pts, GD -15
WPFC Black B00           28  42  25   5   0   0   0   0  1st w 32 pts, GD 21
Eastside FC Red B00      11  26  47  15   1   0   0   0  2nd w 28 pts, GD 18
Seattle United Copa B00  60  28  11   1   0   0   0   0  3rd w 26 pts, GD 17
WA Rush Nike B00          0   0   0   3  17  28  31  21  7th w 12 pts, GD -9
SSC Shadow A B00          0   0   0   1   5  13  26  55  6th w 13 pts, GD -12
Crossfire Premier A B01   0   0   1  11  41  26  14   6  8th w  5 pts, GD -17 

Here's the second analysis for RCL D2.  Here summer results would have put SU Tango and Highline with high probability in the top 3, but only SU Tango was. 


                           1st 2nd 3rd 4th 5th 6th 7th 8th
PacNW Maroon B00             4  19  34  23  13   5   2   0  2nd w 28 pts
NWN Red B00                  0   0   2   5  12  26  31  24  7th w 5 pts
Eastside FC White B00        1   6  16  26  29  14   6   2  5th w 21 pts
Highline Premier Blue B00   18  48  21   9   3   1   0   0  4th w 22 pts
Snohomish United Black B00   0   0   2   6  14  28  29  21  3rd w 24 pts
Westsound FC Red B00         0   0   0   2   5  14  28  51  8th w 4 pts
Seattle United Tango B00    76  18   4   1   0   0   0   0  1st w 32 pts
WPFC White B00               1   8  20  29  25  11   4   1  6th w 21 pts

Tuesday, December 18, 2012

League Comparisons B98

The B98's show a lot of leagues with huge variance---these are leagues were the top few teams score heavily against the bottom teams.  You see this in the standings by ca 50 and -50 goal differentials for the top and bottom teams.   Leagues where there are 1 or 2 teams way below the others are cases where you see goal differentials of -90 to -70 for the bottom teams.  Perhaps this is a developmental issue since the pattern is seen across the B98 leagues.  These are mostly 8th grade boys, and that age is characterized by huge developmental differences; some 8th graders still look like boys while others look almost like men.

I've circled two cases where teams in a lower league are higher than the top team in the next league up.  All of these are cases of new teams coming into a league.  One is the new B98 team that entered the RCL via the Open Cup and was placed in D3. The other circle is for 3 new teams in the PSPL that were placed in Classic 1.

Another interesting difference from the younger leagues is the strength of the WSPL. In the three younger ages I've looked at---G01, B00, B99---the WSPL is similar to RCL D2, but for the B98s, it is a little below RCL D2.   RCL D1 U14 shows some interesting similarities and differences from RCL D1 U12 and 13.  Like in the younger ages, we see a couple D1 teams that are much stronger than the other D1 teams, but in U12 and U13, D1 was pretty tight in terms of strengths.  In U14, it has become very spread out in strength---like many of the BU14 leagues.  This manifests itself in huge goal differentials in these spread out leagues.

League Comparison G01

Scaled so that 0 is the median strength of the G01 teams.

Thursday, December 6, 2012

Effect of age cut-offs on birth months of Div I college players

Following up on the birth month variations that are seen in the US Soccer Development Academy (USSDA) teams, I was curious to see if we see evidence of these age cut-off (Aug 1 club, Dec 31 ODP, Aug 31 HS) when we look at the distribution of birth months of players on Division 1 college soccer teams.  Participation on USSDA teams and top select (non-USSDA) teams might be expected to increase a high school player's chances of making a Div I college team, thus the deficit of quarter 4 births in the USSDA teams and May-June births on top select teams might carry over to college roster.

I took all Div 1 teams that made it to post season play (http://www.ncaa.com/interactive-bracket/soccer-men/d1) and took birth months off their rosters.  I was able to get data on 562 players.  I excluded players who did not go to high school in the United States or Canada.  In retrospect, maybe I should have left off the Canadians, but there weren't all that many of them anyhow.  Then I went to the CDC and got the number of births by month for 1990-1994 to come up with expected numbers of players with each birth month.


The blue line shows the actual number of college players with the specified birth month and the red line shows the expected number given the births by month in 1990-1994.

Here are the differences (actual minus expected):


There is a deficit of 16.36 players with birth months in December. Interestingly there is a surplus of almost the exact number of players 16.34 with birth months in January.  Note this is based on a random sample of 562 players from the top Div I teams. If the pattern holds though-out the Div I rosters, then the total deficit of Dec players will be in the hundreds.

We also see that May-June birth months show a deficit while fall birth months have a surplus.  These patterns correspond to what we would expect given the age cut-off affecting US elite soccer players: Dec. 31 for the US Development teams and Aug 1 for select club teams.   Cut-offs for high school will also be important since many players are identified via performance on their high school teams.  School cut-offs vary regionally however.  The difference between percent summer and fall birth month may simply reflect a fall birth month advantage for D1 university students in general and have nothing to do with soccer age cut-offs.  It is well-known that the academic performance of kids born in summer is lower (on average) than that of those born in fall.  The effect is strongest in elementary school but can be seen all the way through high school.  See for example this literature review.

The 95% confidence intervals are about +13 and -13 for this so January and December fall outside of that while the summer months do not.  This suggests that I need to up the sample size a bit. 

I was able to find birth months data for 27 of the Div I teams that made it to post-season play.  When some birth dates were present for some players and others weren't, I collected data for the players I could.  I only took birth dates from the school roster webpages.  If a birth date was missing, but the players was on a US Dev team, I did not look up their birth date from the US Dev website since I assumed that would skew the data to January.  I only included players who went to high school in the US or Canada.
http://www.ncaa.com/interactive-bracket/soccer-men/d1
I got data for
Kentucky, Elon, Louisville, Marquette, UMBC, Boston College, Xavier, Winthrop, Mich State, UAB, U San Diego, UCLA, VCU, Cleaveland State, UConn, Creighton, Dickinson, Old Dominion, Syracuse, UNC, U Maryland, Indiana Univ, Wake Forest, Northeastern, Tulsa, Akron, UNM

The following schools did not have birth months on their websites:
Univ S Florida, Charlotte, St. Johns, Notre Dame, Air Force, UW, Drexel, Georgetown, Niagara, SMU, Cornell, Northwestern, Michigan, Lafayette