Showing posts with label league comparison. Show all posts

Wednesday, March 12, 2014

RCL D1 regional distribution

Here I look at the regional distribution of boys teams in the RCL D1 for fall 2013.  The RCL D1 is the strongest level of play in WA for all age groups except B97.  RCL is a closed league (closed to the clubs shown in the graphs).  However, except for B97, most WA teams at this level are playing in this league (the largest soccer clubs in WA are in the RCL so this is not surprising).

BU11-14
RCL is a state-wide league, but the top division in BU11-14 (32 teams) has about the lowest travel of any league/division.  Almost all teams (29 of 32) come from the SE Seattle-Tacoma-Bellevue Metro area: Redmond, Seattle, Preston, Woodinville, Tukwila, and Tacoma.  The longest distance, Woodinville-Tacoma is 50miles (ca 1 hr) and most games would involve under 30min of travel.  In the fall 2013 season, there were no teams from E WA, W side of Puget Sound or the Portland Metro area in RCL D1.  There was 1 team from N WA (Bellingham) and 2 from the N Seattle-Tacoma-Bellevue Metro area (Everett area).

BU15-18
At the HS age, BU15-18 (again 32 teams) the regional distribution of teams is more diverse and more "state-wide".  In fall 2013, most teams (21 of 32) still came from the SE Seattle-Tacoma-Bellevue Metro area. But N WA (Bellingham) had a team at 3 of the 4 age groups, and N Seattle Metro area (Everett) at least 1 team at each age group although these teams were not in the same club. There are 3 N Seattle Metro area RCL clubs: NWN, Rush and Snohomish. At U15, Rush had a team in D1, at U16 Snohomish, at U17 both Snohomish and Rush, and at U18 NWN.  This suggests that the N Seattle Metro area only has sufficient players to support 1 D1 team at the HS age.  This might explain why there are no D1 N Seattle Metro teams at BU11-14 as significant cross-club player-migration is needed to form a D1 team and this doesn't happen until HS age.

The Bellingham Metro area, despite being only the 5th largest metro area in the state, is well-represented in the HS RCL D1 with teams at 3 of the 4 ages.  The 4th largest metro area in WA is the Tri-Cities and is again is about 2x the size of the Bellingham metro area, but had only 2 teams in D1.  The N Portland Metro area (WA side) is the 3rd largest metro area and also about 2x as big as Bellingham, but is even less represented in RCL D1 at the HS age (1 team).  The second largest metro area in WA, the Spokane metro area, has no teams in the RCL D1.


What is driving these patterns?  The most obvious is population size.  If we look at county size versus # of HS boys teams in the RCL D1, we see see a strong relationship. 
  • King Co: Crossfire, SU, Eastside, PacNW, FCA
  • Snohomish: Snohomish United, NWN, WA Rush
  • Pierce: WPFC, FWFC, Harbor, Slammers
  • Spokane: SSC
  • Clark+Skamania: WA Timbers
  • Tri-Cities (Benton+Franklin)+Yakima: Three Rivers and Three Rivers Yakima
  • Whatcom+Skagit: Whatcom Rangers
  • Kitsap+Mason: Westound
  • #s from here http://en.wikipedia.org/wiki/Washington_statistical_areas


A couple things jump out:
  • Whatcom Rangers appears to over-produce RCL D1 teams relative to what you would expect given the population size of Whatcom+Skagit counties.  Both the Whatcom region has PSPL "competitors" but not at the RCL D1 level.
  • Spokane metro area has 2-3 fewer RCL D1 teams than expected.  However Spokane does have 3 HS teams at RCL D1 strengths, but they do not play in the RCL D1 (2 in PSPL D1 and 1 in RCL D2).
When we plot the same relationship for the younger ages U11-14 (red line and dots), there seems a very different pattern:
 First, it looks like the size of the player pool has a much bigger effect at the younger ages.  There seems to be a minimum population size of about 500,000 before a region is able to produce a team strong enough to compete in the RCL D1.

HOWEVER, there RCL is promotion-relegation and it may be that there is a initial selection bias at U11 towards the King County clubs and that this takes a few seasons to work its way out.  Next up, I want to repeat this but with my team strength estimates which won't have this initial selection bias.


Tuesday, March 11, 2014

Where WA boys U11-14 play select soccer

I took all the teams BU11-14 and divided them into E WA vs W WA.  There are 546 boys teams in the WA select soccer leagues.


Where W WA plays
65% of W WA boys U11-14 teams play in the USYS leagues: PML, DIII, NPSL, and RCL. The main leagues are the NPSL and RCL.  The former is open to all USYS leagues while the latter is a closed league with only some USYS clubs sanctioned as "RCL" clubs.  The strongest teams in the state play in RCL division 1 (15 out of 16) and come from almost exclusively four western WA clubs: Seattle United, Eastside, WPFC, and Crossfire Premier (15 out of 16 with the 16th being another W WA club).  PML, DIII, and NPSL are regional leagues serving respectively Vancouver/Portland region, south Puget Sound, and north Puget Sound.  Outside of RCL division 1, the strength of competition in the leagues overlaps considerably.  35% of W WA boys U11-14 teams play in the USCS leagues: PSPL and OPL.  OPL serves the Vancouver area WA teams (and Oregon) and PSPL is a state-wide league.  However, approx 20% of W WA teams in the PSPL are in the Copa division which is restricted to western WA.


Where E WA plays
In contrast to W WA, only 30% of boys U11-14 teams play in the USYS leagues: DIV and RCL. 70% of E WA boys U11-14 teams play in the USCS leagues: PSPL and PSPL-inland.  PSPL is the state-wide league and PSPL-inland is restricted to eastern WA teams.  The strongest eastern WA teams generally (9 out of the top 16) play in the PSPL league, with the older ages more often in the WSPL (state-wide) and younger strong teams often found in the PSPL-inland league.  5 out of the top 16 eastern WA teams play in the RCL and 2 in the DIV league.


Saturday, March 23, 2013

Fall league comparison B99

Scaled so that 0 is the median strength of the B99 teams. This uses my old scaling but shows the relative strengths of the WA, OR and BC B99 leagues.

Fall league comparisons B00

Scaled so that 0 is the median strength of the B00 teams. Note this is uses the old scaling of teams, but shows how the WA, OR and BC fall leagues compare.

Tuesday, December 18, 2012

League Comparisons B98

The B98's show a lot of leagues with huge variance---these are leagues were the top few teams score heavily against the bottom teams.  You see this in the standings by ca 50 and -50 goal differentials for the top and bottom teams.   Leagues where there are 1 or 2 teams way below the others are cases where you see goal differentials of -90 to -70 for the bottom teams.  Perhaps this is a developmental issue since the pattern is seen across the B98 leagues.  These are mostly 8th grade boys, and that age is characterized by huge developmental differences; some 8th graders still look like boys while others look almost like men.

I've circled two cases where teams in a lower league are higher than the top team in the next league up.  All of these are cases of new teams coming into a league.  One is the new B98 team that entered the RCL via the Open Cup and was placed in D3. The other circle is for 3 new teams in the PSPL that were placed in Classic 1.

Another interesting difference from the younger leagues is the strength of the WSPL. In the three younger ages I've looked at---G01, B00, B99---the WSPL is similar to RCL D2, but for the B98s, it is a little below RCL D2.   RCL D1 U14 shows some interesting similarities and differences from RCL D1 U12 and 13.  Like in the younger ages, we see a couple D1 teams that are much stronger than the other D1 teams, but in U12 and U13, D1 was pretty tight in terms of strengths.  In U14, it has become very spread out in strength---like many of the BU14 leagues.  This manifests itself in huge goal differentials in these spread out leagues.

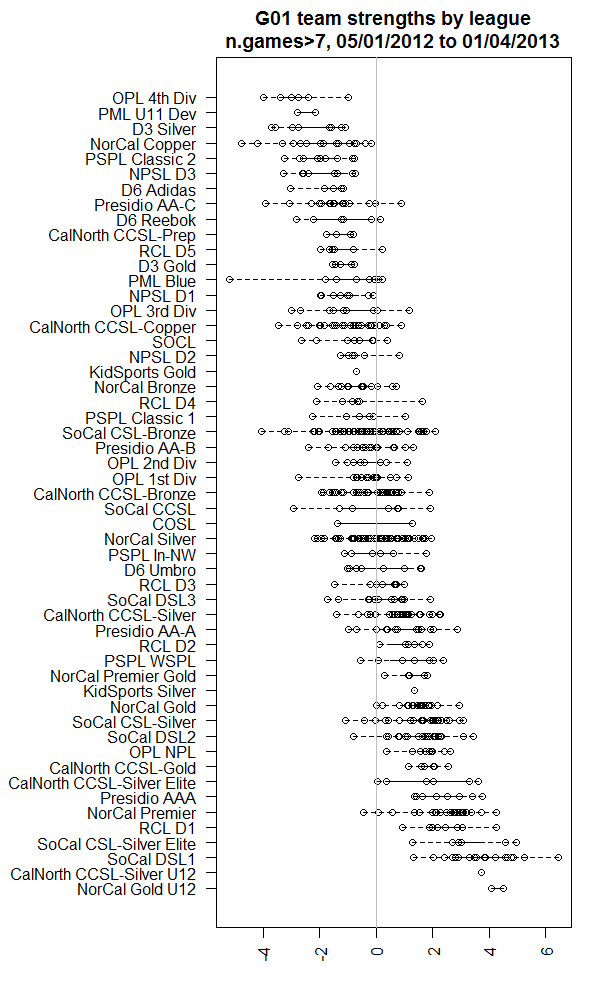
League Comparison G01

Scaled so that 0 is the median strength of the G01 teams.

Friday, November 23, 2012

Comparison of league strengths for B00 and B99

Here's the league strengths plot using those draft b99 rankings.   In the plot, 0 is the median strength of teams in B99.  A team with a strength of 1 over another would be expect to win about 60% of the time, and with a strength of 2 over another would be expected to win about 85% of the time.

Here are the medians for that plot.
          BCPL         RCL D1        OPL NPL         RCL D2      PSPL WSPL
         3.555          2.555          2.100          1.760          1.670
PSPL Classic 1    OPL 1st Div       D6 Umbro       PML Blue         RCL D3
         0.760          0.295          0.380          0.320          0.465
       D3 Gold        NPSL D1    OPL 2nd Div   PSPL In-Copa PSPL Classic 2
        -0.185          0.280         -0.245         -0.325         -0.945
         D3 S2         RCL D4          D3 S1      PSPL Copa        NPSL D2
        -0.860         -1.290         -0.685         -1.420         -1.170
       PML Red    OPL 3rd Div      D6 Reebok
        -1.725         -1.960         -2.280

For comparison, here's the same plot for b00.  Strengths have the same interpretation but now everything is scaled to the median b00 team.

Here's the medians for the b00's:
      BCPL       RCL D1      OPL NPL    PSPL WSPL       RCL D2     PML Blue
       3.910        3.265        2.230        2.060        1.870        1.610
 OPL 1st Div      NPSL D1       RCL D3 PSPL Classic  OPL 2nd Div     D6 Umbro
       0.645        0.570        0.165        0.260        0.120        0.335
     D3 Gold PSPL In-Copa    PSPL Copa      NPSL D2  OPL 3rd Div       RCL D4
      -0.515       -0.585       -0.960       -0.740       -1.350       -0.910
     PML Red        D3 S1        D3 S2    D6 Reebok        D3 S3  OPL 4th Div
      -1.630       -1.235       -1.635       -1.205       -1.700       -1.740
   D6 Adidas
      -3.340

Some interesting similarities and differences.  In both, there is a big gap in the RCL D1 rankings.  2-3 teams are distanced from the others.  The median difference between RCL D1 and PSPL WSPL is similar (about 1).  Overall median league strengths seem pretty similar across the b00's and b99's with the top district leagues being about RCL D3.  Big difference is that in this preliminary analysis, a lot of the top b99 leagues have teams that could hang with the bulk of RCL D1.  That doesn't look so true in b00.  But the top of D1 is well out from from best teams in all other leagues (with the exception of ISC A in the b00's).